Description
In the Catalog, we publish equatorial (α2000, δ2000) and galactic (l,b) coordinates of cluster centers derived as the position of overdensity in 2MASS catalog (Koposov et al. 2008). Distances, color-excesses and ages are the mean-square values calculated using all available evaluations from different color-magnitude diagrams. Errors are their rms deviations. There are individual pages for every cluster where all available plots and parameters are published. Images of the size 8.5' x 10' in J-band are taken from 2MASS catalog. For some clusters, we present 15' x 15' images from DSS. Fitted isochrones are taken from Girardi et al.(2002). To convert the color excesses determined using different CMD into the color excess E(B-V) and to calculate the distance modulus, we employed the following relations:
AK_s=0.670 x E(J-Ks)
(Dutra et al., 2002)
AV=3.08 x E(B-V), E(V-Ic)=1.35 x (B-V), E(V-J)=2.25 x E(B-V),
E(V-H)=2.57 x E(B-V) (He et al., 1995)
To fit an isochrone in the (U-B,B-V) diagram, we shifted it along the line E(U-B)=0.72 x E(B-V).
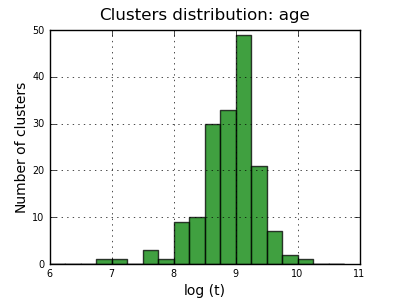
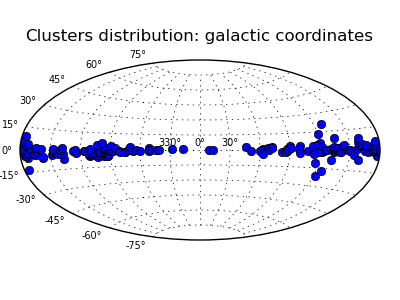
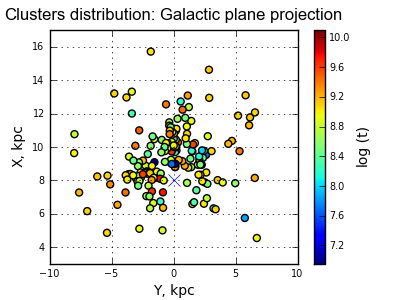
Here are some basic subset characteristics (click for large image):